Note
Go to the end to download the full example code. or to run this example in your browser via Binder
Rotate and derotate a sample image#
This tutorial demonstrates how to simulate the effect of a line-by-line rotation in a line-scanning microscope and how to correct for it using the derotation module.
- We will:
Create a synthetic image.
Simulate the effect of per-line rotation over a stack of frames.
Apply derotation to revert to the original image.
Visualise the original, rotated, and derotated images.
Explore the effect of varying rotation angles.
Imports#
import matplotlib.pyplot as plt
import numpy as np

from derotation.derotate_by_line import derotate_an_image_array_line_by_line
from derotation.simulate.line_scanning_microscope import Rotator
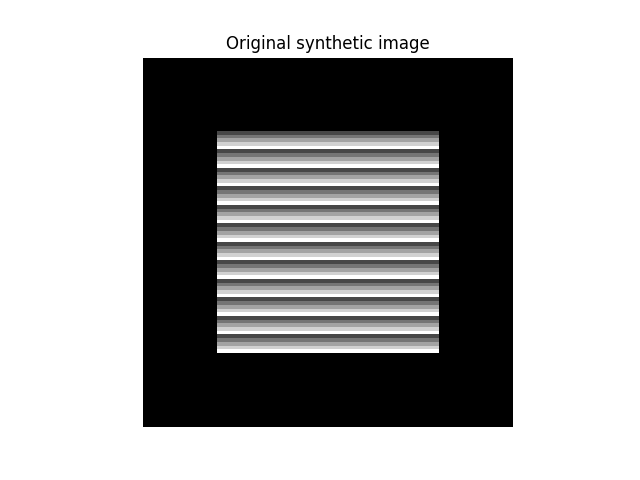
Create synthetic image#
We generate a 100x100 image with horizontal bands of varying intensity. This will help visualise the rotation effects clearly.
image = np.empty((100, 100))
gray_values = [i % 5 * 100 + 155 for i in range(100)]
for i in range(100):
    image[i] = gray_values[i]

# Add a black border for easier visual inspection

image[:20] = 0
image[-20:] = 0
image[:, :20] = 0
image[:, -20:] = 0

# Show the synthetic image

plt.imshow(image, cmap="gray")
plt.title("Original synthetic image")
plt.axis("off")
plt.show()
Generate stack and simulate rotation#
We’ll make a stack of 3 frames and simulate a line-by-line rotation using increasing angles for each line.
image_stack = np.array([image, image, image])
num_lines = image_stack.shape[0] * image_stack.shape[1]
angles = np.arange(num_lines)  # 0 to num_lines-1 degrees

# Print info about the angles

print(f"Total number of angles: {len(angles)}")
print(f"Angle range: {angles.min()}° to {angles.max()}°")

# Simulate rotation

rotator = Rotator(angles, image_stack)
rotated_image_stack = rotator.rotate_by_line()
Total number of angles: 300
Angle range: 0° to 299°

  0%|          | 0/3 [00:00<?, ?it/s]
100%|██████████| 3/3 [00:00<00:00, 44.42it/s]
Apply derotation#
Use our derotation method to revert the rotated images.
rotated_image_stack_derotated = derotate_an_image_array_line_by_line(
    rotated_image_stack, angles
)
  0%|          | 0/300 [00:00<?, ?it/s]
100%|██████████| 300/300 [00:00<00:00, 26888.29it/s]
Plot original, rotated, and derotated images#
num_frames = len(rotated_image_stack)
fig, ax = plt.subplots(2, num_frames, figsize=(5 * num_frames, 8))

# Plot rotated images with angle labels

for i in range(num_frames):
    ax[0, i].imshow(rotated_image_stack[i], cmap="gray")
    ax[0, i].set_title(f"Rotated image {i + 1}")
    ax[0, i].axis("off")

    # Get angle slice for this frame
    angle_slice = rotator.angles[i * num_lines : (i + 1) * num_lines]
    if angle_slice.size > 0:
        angle_range = f"{angle_slice.min():.0f}–{angle_slice.max():.0f}°"
        ax[0, i].text(
            0.5,
            0.9,
            angle_range,
            horizontalalignment="center",
            verticalalignment="center",
            transform=ax[0, i].transAxes,
            color="white",
            fontsize=10,
            bbox=dict(facecolor="black", alpha=0.5, boxstyle="round"),
        )

# Plot derotated images

for i in range(num_frames):
    ax[1, i].imshow(rotated_image_stack_derotated[i], cmap="gray")
    ax[1, i].set_title(f"Derotated image {i + 1}")
    ax[1, i].axis("off")

plt.tight_layout()
plt.show()
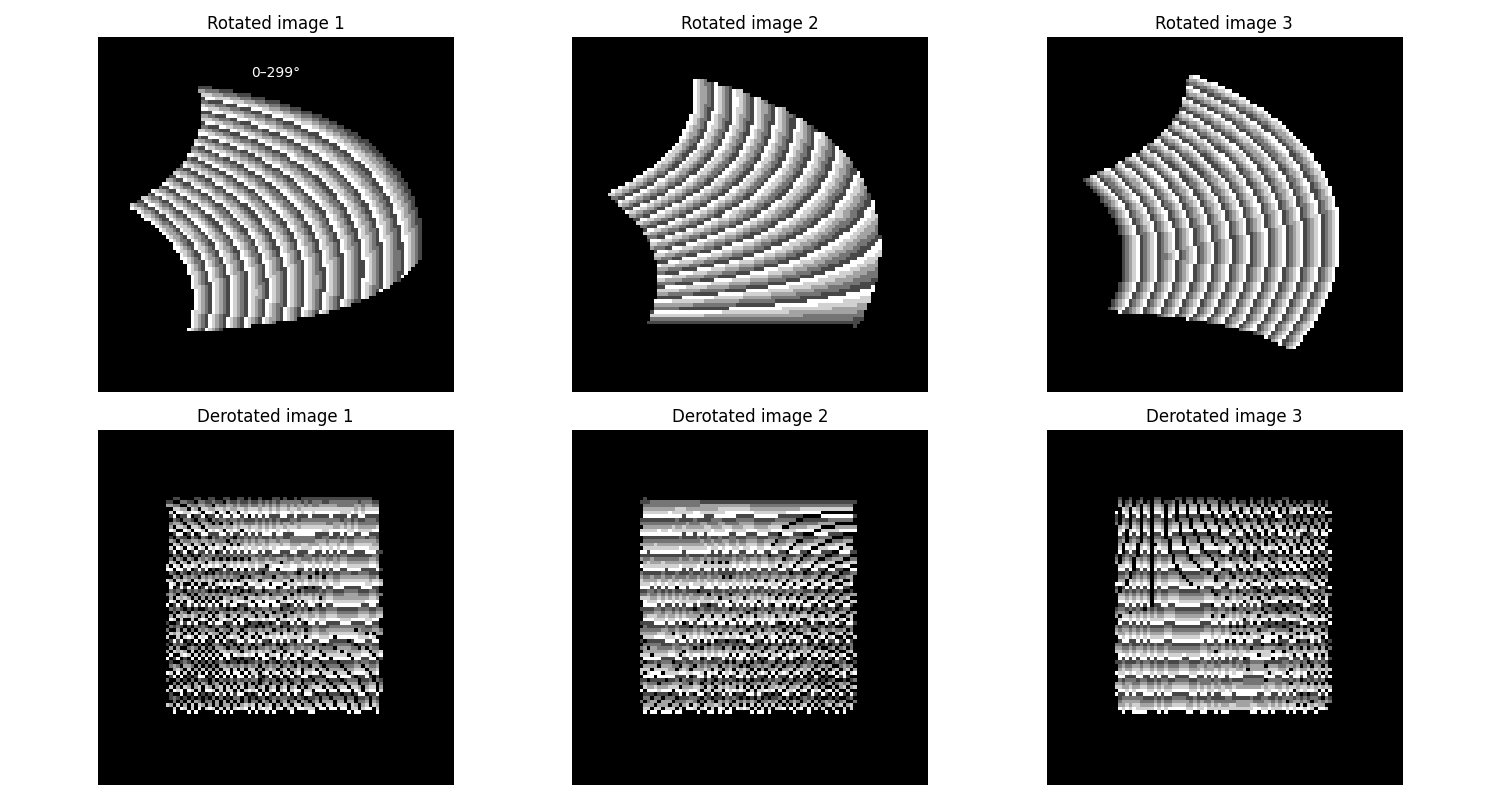
Conclusion#
We have simulated a rotating image acquisition scenario, applied derotation to correct the distortions, and visualised the impact of line-by-line rotation. Notice how the derotated images recover the original structure.
Total running time of the script: (0 minutes 0.336 seconds)