Note
Go to the end to download the full example code. or to run this example in your browser via Binder
Derotate a TIFF movie line-by-line using precomputed rotation angles#
This script demonstrates how to load a 3D TIFF image stack (frames × height × width) and apply line-by-line derotation using a set of precomputed rotation angles.
Each horizontal line in the image is rotated by a specific angle (in degrees), allowing correction for sample motion or intentional rotation during acquisition.
Inputs:
angles_per_line.npy: A 1D NumPy array of angles in degrees, with one value per image line
rotation_sample.tif: A TIFF stack to be derotated.
The script computes the derotated movie and displays the mean image of the derotated stack.
import matplotlib.pyplot as plt
import numpy as np
import tifffile

from derotation.derotate_by_line import derotate_an_image_array_line_by_line
from derotation.sample_data import fetch_data
Load per-line rotation angles
angles_path = fetch_data("angles_per_line.npy")
print(f"Loading per-line rotation angles from {angles_path}")
angles_per_line = np.load(angles_path)  # Shape: (height,)
Loading per-line rotation angles from /home/runner/.derotation/data/angles_per_line.npy
Load the TIFF stack (shape: num_frames × height × width)
tif_path = fetch_data("rotation_sample.tif")
print(f"Loading image stack from {tif_path}")
image_stack = tifffile.imread(tif_path)

print(f"Image stack shape: {image_stack.shape}")
print(f"Angles per line shape: {angles_per_line.shape}")
Loading image stack from /home/runner/.derotation/data/rotation_sample.tif
Image stack shape: (270, 256, 256)
Angles per line shape: (75471,)
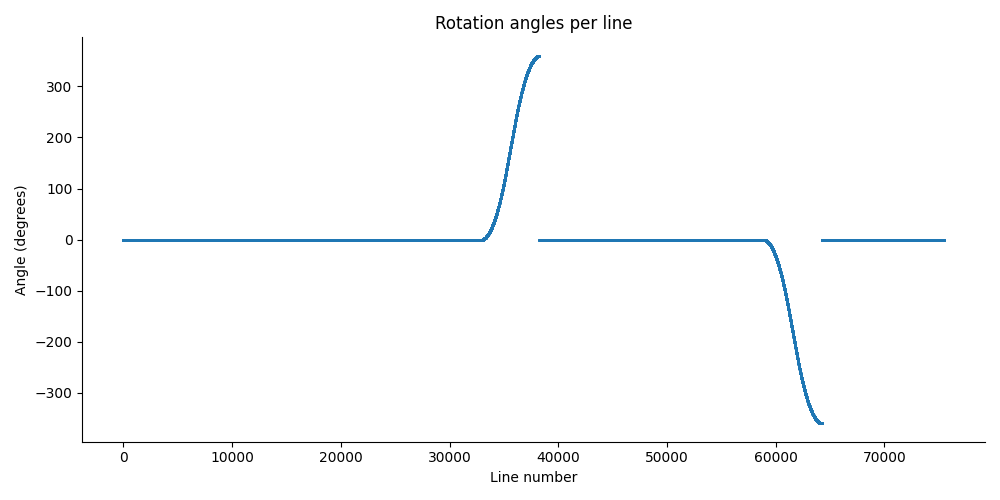
See the angles
fig, ax = plt.subplots(figsize=(10, 5))
ax.scatter(np.arange(angles_per_line.shape[0]), angles_per_line, s=1)
ax.set_title("Rotation angles per line")
ax.set_xlabel("Line number")
ax.set_ylabel("Angle (degrees)")
ax.spines["top"].set_visible(False)
ax.spines["right"].set_visible(False)
plt.tight_layout()
plt.show()
Set derotation parameters
see derotation.analysis.full_derotation_pipeline.FullPipeline
.find_image_offset() for more details on finding the offset value
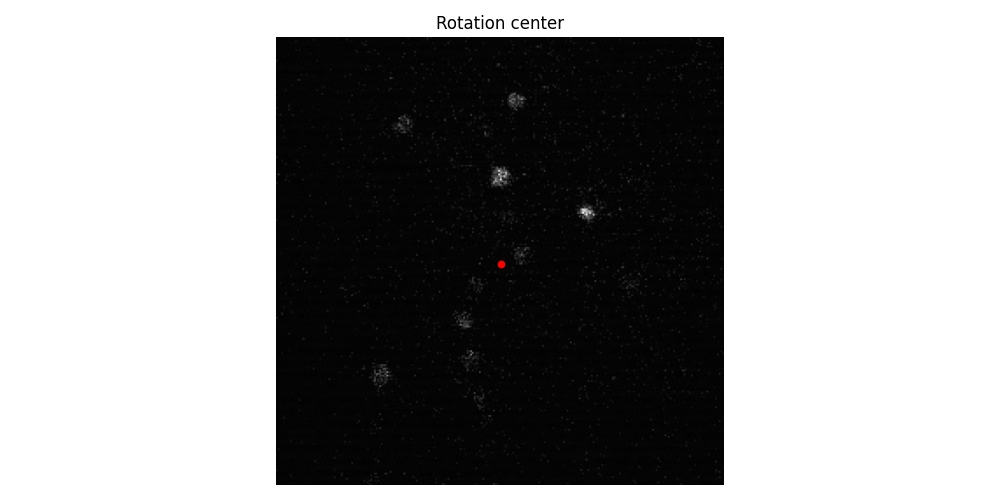
rotation_center = (129, 128)  # (y, x) format
blank_pixels_value = -3623  # Value for pixels outside the rotated area

print(f"Applying derotation with center: {rotation_center}")
Applying derotation with center: (129, 128)
plot first frame with rotation center
fig, ax = plt.subplots(figsize=(10, 5))
ax.imshow(image_stack[0], cmap="gray")
ax.scatter(rotation_center[1], rotation_center[0], color="red", s=20)
ax.set_title("Rotation center")
ax.axis("off")
plt.tight_layout()
plt.show()
Perform line-by-line derotation
derotated_stack = derotate_an_image_array_line_by_line(
    image_stack=image_stack,
    rot_deg_line=angles_per_line,
    center=rotation_center,
    blank_pixels_value=blank_pixels_value,
)
  0%|          | 0/69120 [00:00<?, ?it/s]
 48%|████▊     | 33051/69120 [00:00<00:00, 330421.30it/s]
 96%|█████████▌| 66094/69120 [00:00<00:00, 108793.91it/s]
100%|██████████| 69120/69120 [00:00<00:00, 124383.27it/s]
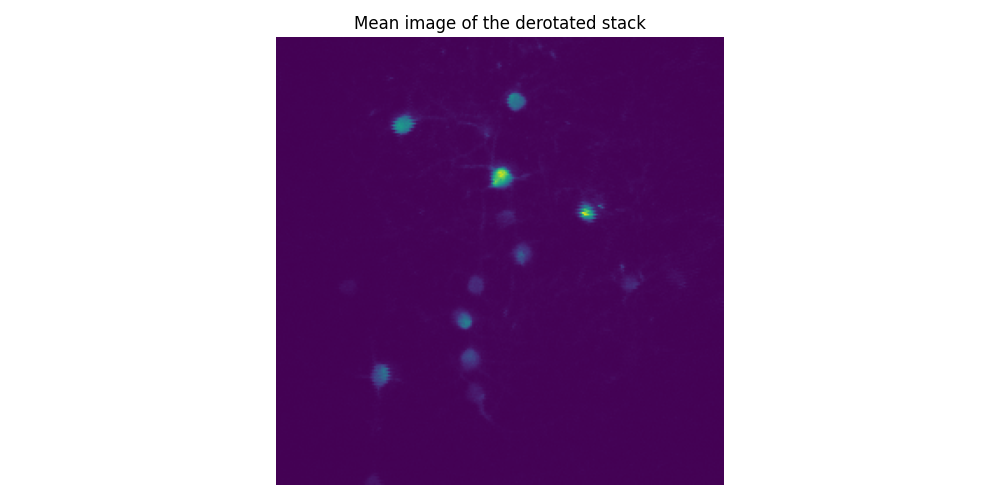
Visualize the result by taking the mean
mean_image = np.mean(derotated_stack, axis=0)

fig, ax = plt.subplots(figsize=(10, 5))
ax.imshow(mean_image, cmap="viridis")
ax.set_title("Mean image of the derotated stack")
ax.axis("off")
plt.tight_layout()
plt.show()
Total running time of the script: (0 minutes 0.957 seconds)